
The Reality of Underperformance: Active Funds vs Passive ETFs
Nearly 90 percent of fund managers fail to beat their benchmark indices, according to Standard & Poor’s. This is a bit of a shock, given that the standard hedge fund charges a 2 percent management fee and takes 20 percent of profits off the top. Compare that with the fees on the least expensive S&P 500 exchange-traded funds, which can be as low as three-tenths of one percent. These low-cost ETFs have beaten the actively managed funds repeatedly for decades!
The numbers look even more dire when you compare the active funds and the passive ETFs on a risk-adjusted basis. This involves putting the measure of risk most often used, the investment’s volatility, in the denominator and the return in the numerator.
Since investors get paid for taking risk – U.S. Treasuries in normal times yield far less than junk bonds – this shows how much return the investor is earning for each unit of risk. According to Standard & Poor’s, which tracks this information on a risk-adjusted basis, passive benchmarks outperform active fund managers 95 percent of the time.
Factors Contributing to Underperformance
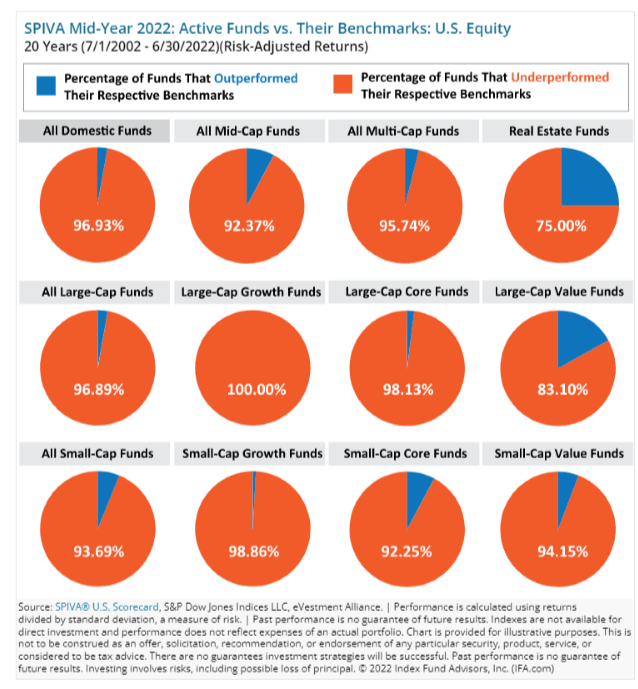
When Alfred W. Jones coined the term “hedge fund” for his new investment vehicle in 1949 he was playing on the appeal of a lower risk, or hedged, long-short equity strategy. S&P’s figures indicate that investors now are getting the reverse – more risk, higher fees, and a lower risk-adjusted return than their unhedged benchmarks. Here is the data from S&P’s mid-year 2022 comparison of risk-adjusted returns of active funds and their benchmarks for the last 20 years.
Even when the actively managed funds show a positive return, they fall short of the benchmarks. For example, Hedge Fund Research’s HFRI Institutional Fund Weighted Composite Index, a global, equal-weighted index of hedge funds with minimum assets under management of $500 million, had an annualized five-year return of 4.56 percent as of September. The S&P 500 returned 11.58 percent over about the same period.
There is at least a half-dozen reasons why this is the case.
Size
The massive size of funds that are actively managed by the industry’s behemoths – Vanguard, Fidelity, Schwab, Blackrock and so on – means they cannot beat the market because they are the market. They are so large that any move they make pushes prices up or down, and their strategies are both anticipated and aped by smaller funds. It is far harder to outperform or even keep up with an index when you must make such large giant purchases and sales of securities. And successful firms grow, meaning their advantages in terms of being able to move nimbly in and out of positions diminishes over their lifetimes.
The size of the financial industry also has ballooned in the last 50 years, bringing in more smart analysts, who bring sophisticated analytical techniques to bear on the markets. This means a double whammy for active managers: more scrutiny is brought to bear on their behavior, while their own swollen AUM size means they cannot operate discretely.
Fees
As noted above, fees for actively managed funds far outstrip the passive funds they try and often fail to beat. They range from a handful of percentage points to the usurious 2-and-20 that hedge funds demand. This eats into any net gain they can deliver.
Redemptions and Herd Behavior
Even if an active fund’s portfolio managers are top of class and have terrific ideas to pursue, they must keep cash and marketable securities on hand to pay off investors who want out. This is less of a problem for hedge funds than mutual funds, since the former typically have lock-up periods during which investors cannot sell their stakes.
For example, at the height of the Great Financial Crisis in 2008-2009, investors were demanding their capital back, just when asset managers might have stepped in and supported the market by bargain hunting. Fund managers involved in more complex and hard-to-sell products, like synthetic mortgage-backed securities and derivatives, had to sell to sell their more liquid securities (stocks and Treasuries) to meet redemptions, spreading the crisis throughout the financial system.
The recent tech selloff has caused asset managers to increase their cash holdings. The October 2022 Bank of America Global Fund Manager Survey of 371 managers with a total of $1.1 trillion under management found that portfolio managers had increased their average cash holdings to 6.3 percent, the highest level since April 2021. The flip side of this is true also. During “irrationally exuberant” bull markets, like the dotcom bubble and the 2001 FAANG market rally, investors can force sensible portfolio managers to do stupid things in order keep their business flowing. Both upside and downside herding distort market decision-making and leads to underperformance, as the current tech bust is demonstrating.
Survivorship Bias and Style Drift
These two phenomena are attempts by fund managers to “hit the reset button” after a bad year. Survivorship bias is rampant in the hedge fund world, where one convention is to require a fund to hit a “bogey” – a level of return necessary for it to collect its fees. These are often cumulative so, if the fund fails to hit its bogey, it might simply choose to shut the fund down and start anew. This means that the data set for hedge fund returns is often higher than warranted, since many of the lousiest funds get weeded out.
Style drift is an attempt by a manager to modify the investing strategy of an underperforming fund, short of shutting it down. A long-short fund might start to dabble in global macro or event driven strategies. This is particularly pernicious because it can leave investors with unexpected concentrations of risk, if several of their funds all pile into one fad, like FAANG stocks last year.
Closet Indexing
Closet indexing is when a fund increases its exposure to an index while still claiming to be an active manager. The Yale and NYU academic Antti Petajisto published a study in 2013 examining the percentage of actively managed funds’ assets under management that was invested in the benchmark index.
Petajisto found that closet indexing increased in popularity in 2007-2009 and accounted at the time of his research for about one third of all mutual fund assets. Petajisto wrote, “The performance of closet indexers is predictably poor: they largely just match their benchmark index returns before fees, so after fees they lag behind their benchmarks by approximately the amount of their fees.”
In an earlier paper, Petajisto reviewed Fidelity Magellan’s share of active investments in 1995 which was about 77 percent, a typical value for an actively managed fund. “But by 1997…that had fallen to 46 percent and [it] then continued to decline to as low as 33 percent. In other words, two-thirds of the assets in the Magellan portfolio are simply invested in the S&P 500 index. This is one of the lowest numbers for any non-index stock fund.” Of course, it’s hard to beat the markets over the long term, decades. But good firms with excellent people have proven they can and will. Finding these managers is part of the complexity of investing.