
Everyone can agree that it is preferable to have your investments rise in value faster and farther in good times than they fall in bad times. To pin a pseudo-statistical sounding label to investments of this stripe seems, at first glance, a typical Wall Street marketing affectation. But the importance of what these investments actually deliver – asymmetric returns – reflects three characteristics that prove crucial to investor success during market corrections, like the one we are now experiencing.
The Neglected Elements & Poor Performance
Those three related characteristics are active highly skilled management, proper risk mitigation and clear and attainable growth. Some of these elements are constantly ignored by investors and professional managers for decades and result in poor investment performance. They are ignored because:
- Actively managed accounts did not meet, let along beat, their market (beta) benchmarks, which were pushed skyward by the Fed’s policies, and
- Because indexes and index ETFs were so popular, the only risk metric that mattered was “tracking error” – how far you fell short of your benchmark.
Because of this, most actively managed investments have done terribly since the Great Financial Crisis. Take hedge funds. The second quarter saw the fewest new fund launches since the fourth quarter of 2008 – right after the Lehman Brothers bankruptcy. Only 80 funds launched in the second quarter of 2022, while 156 closed their doors, according to Hedge Fund Research.
This graph shows the performance since 1999 of the S&P 500 in green and the Dow Industrials in blue. The sickly mustard line at the bottom is the IQ Hedge Multi-Strategy Tracker hedge fund ETF, which has barely moved.
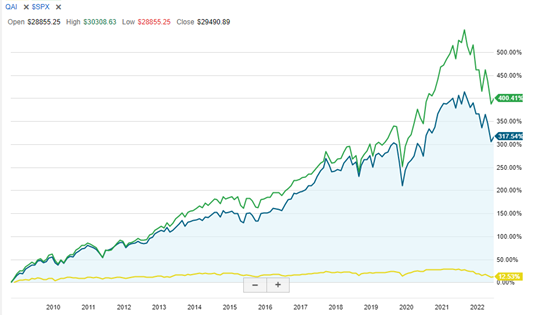
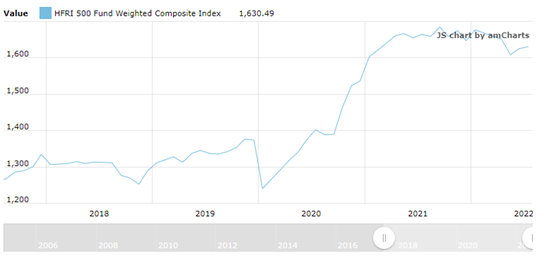
Now take a second look at the graph. When stocks cratered due to COVID-19 in 2020, actively managed funds fared much better. The HFR 500 Fund Weighted Composite Index, shown below, fell less than 10 percent during the 2020 market rout. The S&P 500 fell 30 percent; the Dow, about 35 percent.
What are Asymmetric Returns?
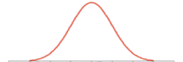
To understand asymmetric returns, first look at a symmetrical return distribution, shaped like the classic Gaussian bell curve. The “Modern Portfolio Theory” taught in business schools is based on this. So are many basic risk tools that are still in use, like “parametric value at risk.” Unfortunately, very few investments behave this way – with price volatility distributed evenly around a central point.
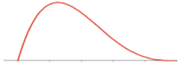
But, more often than not, returns are asymmetrically distributed, as in the image below. There may be more losses than gains, or vice versa.
So what, exactly, are asymmetric trading opportunities? They are the ones where:
“The probability of a positive result is greater than the risk.”
Asymmetric returns fans like to quote Warren Buffett, who likes to quote the father of value investing, Ben Graham. In his classic book on investing, The Intelligent Investor, Graham wrote, “The essence of portfolio management is the management of risks, not returns.”
But the real power in asymmetric returns are when you can take less risk with superior returns. Graham and Buffett both did this through rigorous fundamental analysis of target companies, using discounted cash flow analysis to determine if the asset is 1) undervalued enough to make it a good investment and 2) undervalued enough to include a margin of error in case their calculations or forecasts were off.
Seeking Asymmetric Returns in Practice
One of many many steps is fundamental analysis, by running discounted cash flow calculations over your investment horizon with all material risks identified and quantified. If the asset appears undervalued, and is undervalued enough to provide you with a margin of error, and that calculation is strongly in your favor, you might have found the ideal asymmetrical investment profile.
Here are two examples.
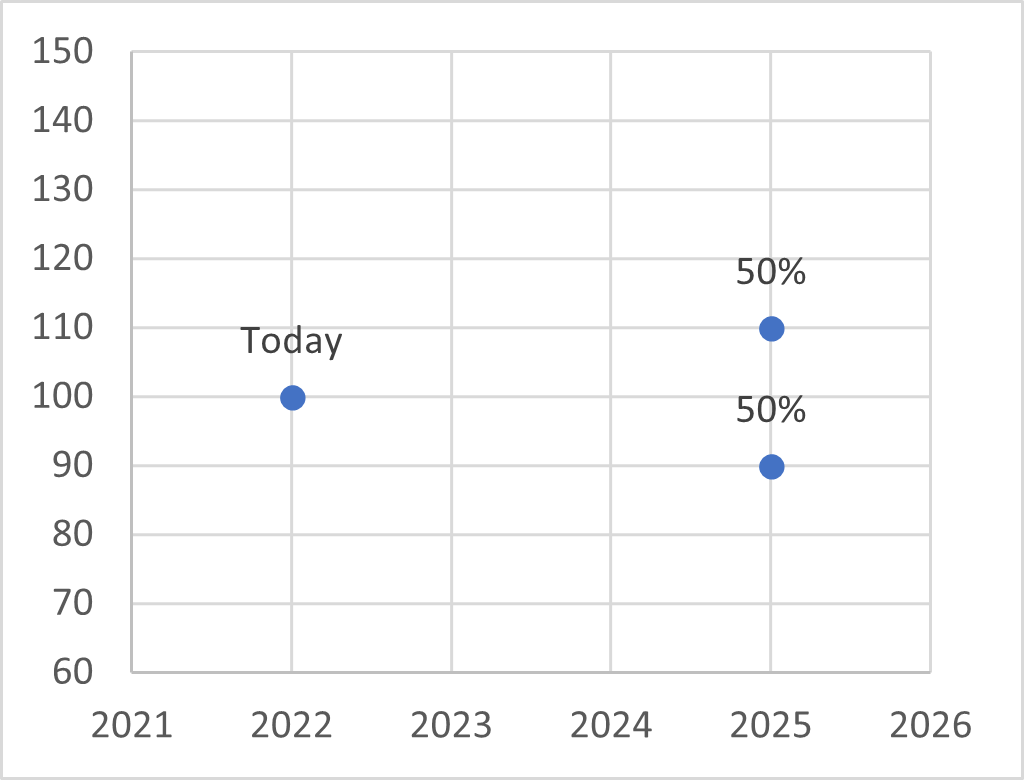
In both cases, you will plan to hold the asset for three years. In case 1, the symmetrical payoff, your discounted cash flow analysis and P&L drawdown risk calculation indicates a 50% chance you will earn 10 percent on your investment, and a 50% chance you will lose 10 percent. Statistically speaking, you should be indifferent to such a payoff matrix, and move on.
Case 1: Symmetrical Payoff
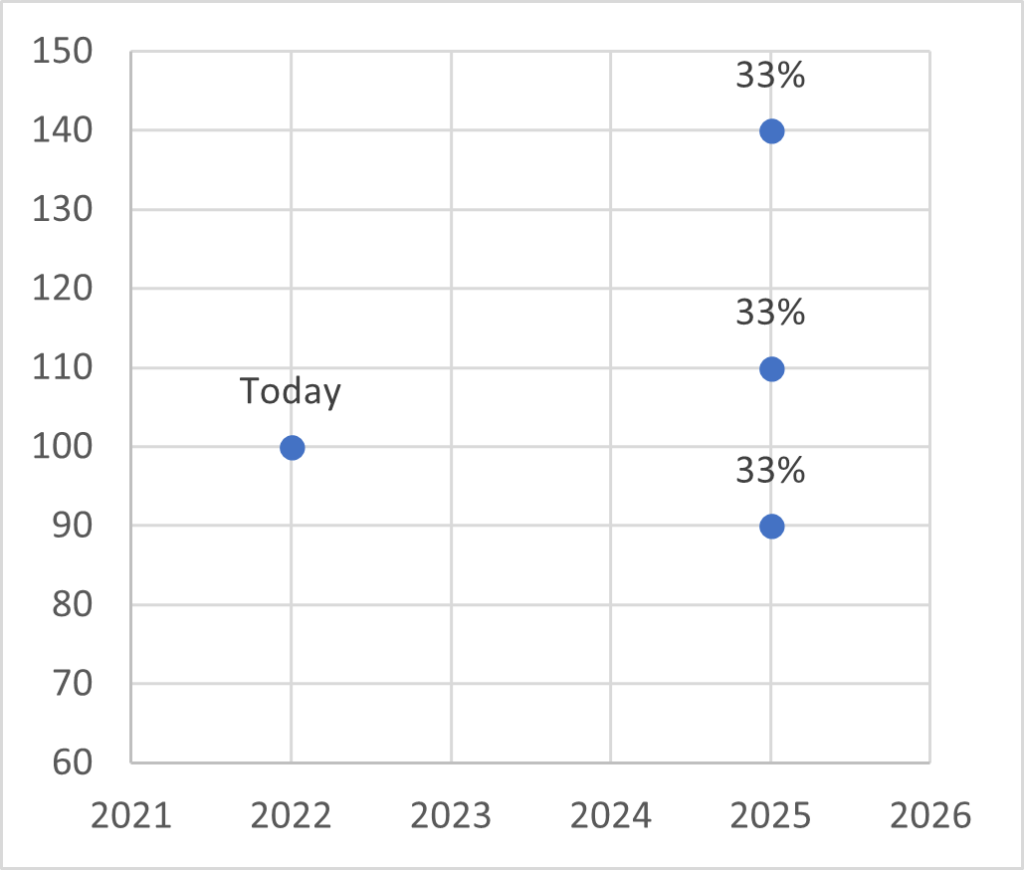
In Case 2, your analysis yields a strong view that there is a 33 percent chance of losing 10 percent, of earning 10 percent, and of earning 40 percent. Since there is a two-thirds chance the deal will pay off, you chose this investment.
Of course, the deal might not pay off, but if you develop a portfolio of enough of these investments with these payoff structures, over time the portfolio should outperform. Our ultimate goals as investors is to outperform while limiting risk.
Case 2: Asymmetrical Payoff
Navigating the Current Market Environment
Given the perilous state of the markets today, investors have to be particularly careful about the investments they make. If you can arrange to be on the right side of an asymmetric investment payoff situation, it will help you ride out the potentially tough times ahead.