The Overlooked Role of Velocity in Inflation
There’s an insidious idea in economics that causes even sophisticated policymakers to blunder again and again. It’s the trope that inflation is caused by printing too much money. With the U.S. Federal Reserve and Congress recently dumping nearly $5 trillion into the economy through monetary and fiscal stimulus to address the Covid pandemic, and inflation recently shooting up to a 40-year high, it might seem that trope has some truth to it. And it does, money printing can and has caused inflation but the focus on money supply as the main cause of inflation overlooks the equally important issue of velocity – how often a unit of currency changes hands. And this misunderstanding with supply chain disruptions is causing a lot of problems.
When it comes to their lessons on inflation, economic textbooks inevitably show pictures of Weimar-era Germans bringing wheelbarrows full of nearly worthless Reichsmarks to the baker to get a loaf of bread. In our own time, Venezuela’s hyperinflation has forced it to repeatedly exchange existing bolivars for new versions – in 2008, it swapped 1,000 old bolivars for one new version, and in 2018, it swapped 100,000 old for one new. In 2021, the country once again hacked six zeros off one of its notes.
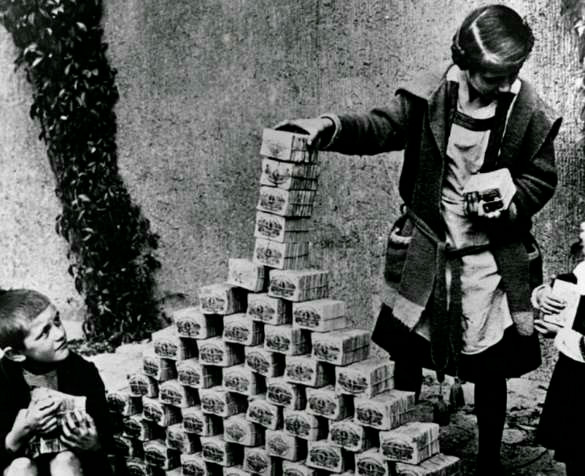
Source: rarehistoricalphotos.com
Rampant money printing has been the conventional diagnosis by mainstream economists for most examples of hyperinflation. So why did the U.S. avoid a similar fate over the last 14 years, as it pumped trillions of dollars into the economy through monetary and fiscal stimulus? The answer lies in the fact that the velocity of the dollar has plunged. Policymakers scrambling to respond to the sharp rise in inflation in recent months need to be mindful of the role of velocity before they mindlessly adopt the same prescription – sky-high interest rates – that policymakers have used in the past to battle inflation.
Catastrophically Misunderstood
First, it’s important to understand what velocity is, and how misunderstanding or ignoring it has tripped up the policymakers at the Federal Reserve and other central banks. Velocity is simply how many times each unit of currency gets used in a domestic transaction in a given time period. It is calculated by dividing GDP by the money supply, which in the U.S. is a measure called M2. If the velocity of money is increasing, then more transactions are occurring between individuals in an economy, and vice versa.
M2 includes M1, which is the money supply of currency in circulation (notes and coins, traveler’s checks from non-bank issuers, demand deposits, and checking deposits). These are used typically for short-term daily consumption transactions – groceries, gasoline, haircuts and the like. M2 is M1 plus time deposits of less than $100,000 and some other items.
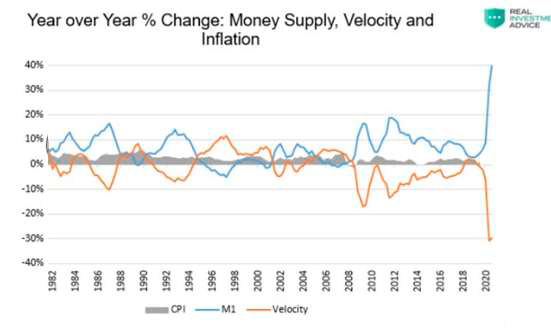
The equation for velocity is simple: GDP/M2, which is the same as saying Prices*Transactions/M2. When the money supply (M2) increases, velocity falls unless either prices or transactions (or both) increase enough to keep it steady. This can be seen in the graph below, which uses M1 rather than M2 but captures the same idea.
Unfortunately for central banks and their main monetary tool – manipulating interest rates – velocity also tends to rise when interest rates rise. That is because higher rates increase the opportunity cost of holding cash. (That’s the cost of all the interest an investor foregoes in a rising-rate environment by holding cash, which does not pay interest.)
So, in the short-term at least, raising rates – as the Fed is now planning – to battle inflation will cause investors to put cash into interest-bearing accounts or securities, reducing M2 and therefore raising velocity. Since the standard definition of inflation is growth in the money supply times velocity (minus growth in GDP), the Fed’s anti-inflationary rate hikes could actually increase inflation.
This is the sort of “unintended consequence” that can happen when policymakers fail to look at the whole picture.
How the Dominos Fall: Inflation, Rates, Recessions and Velocity
In December the Fed was finally forced to abandon its delusion that inflation, then running over 6 percent, was only a temporary phenomenon caused by Covid-related factors. It decided to accelerate its plan to increase the short-term federal funds rate from its current near 0 percent level, and to begin unwinding some of the $8 trillion-plus of assets it has acquired through its Quantitative Easing (QE) bond-buying spree and other programs meant to keep long-term interest rates low.
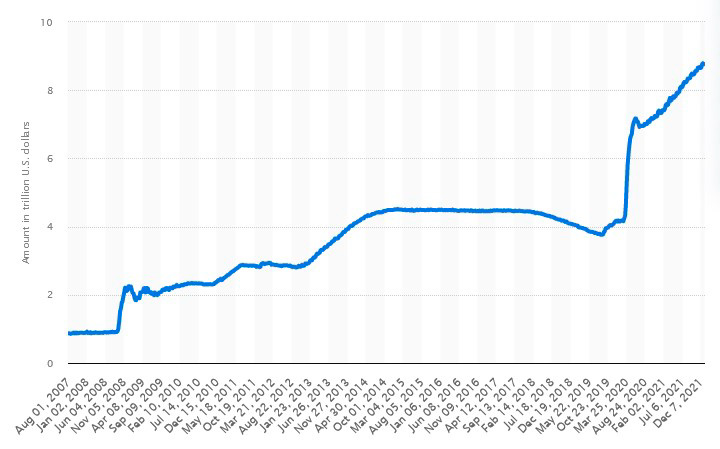
Source: Statista
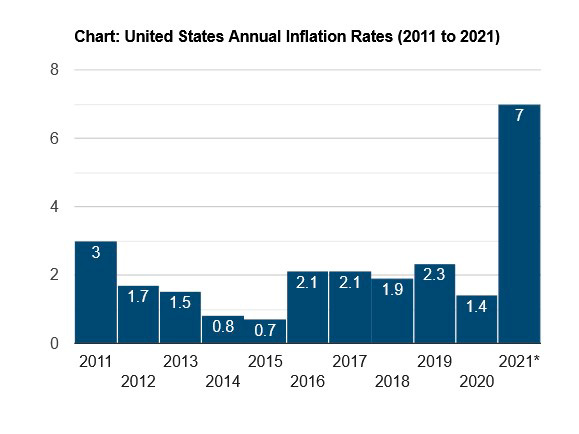
Things got ugly in early January after annualized December inflation came in at a 40-year high of 7 percent. Flustered Fed officials began to speak publicly about increasing the frequency of their interest rate hikes. According to the CME Group’s FedWatch program, the market is now pricing in four hikes in 2022, up from the expected three before the inflation bombshell dropped.
Inflation, rather than deflation – another name for a recession – is now the Fed’s main worry. That’s grim news for the economy: As the graph below shows, every recession but 1991 was preceded – many economists say “caused” – by Federal Reserve rate hikes.
The graph also shows that for decades, the Fed has responded to recessions by slashing the benchmark short-term Fed Funds rate to spur economic activity. That’s problematic now, because even after the four quarter-point increases the Fed is considering this year, the Fed Funds rate will still only be about 1 percent – leaving little room for cutting. And even if the Fed did want to “ease monetary policy” – economists’ euphemism for cutting rates – its hands are tied by the fact that it is simultaneously fighting inflation, and conventional economic thinking holds that such a fight requires higher, not lower, rates.
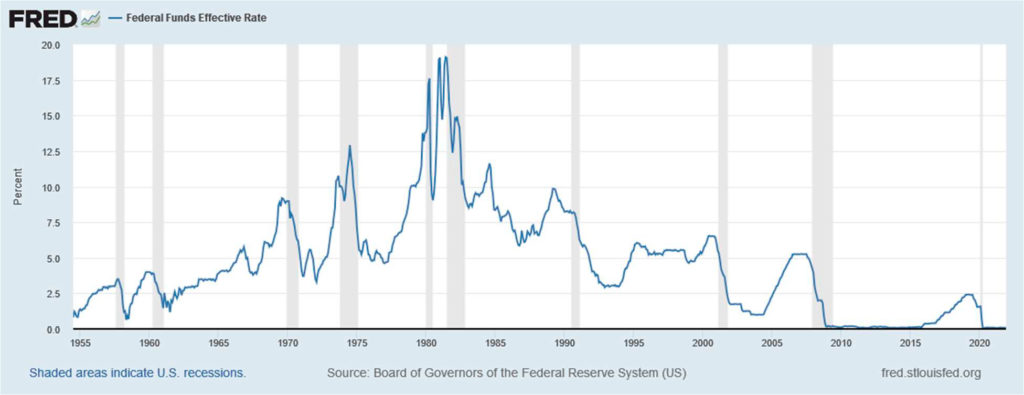
The Fed’s self-imposed impotence can be seen in a comparison of its response to the Great Financial Crisis, where it cut the Fed Funds rate by about 5 percentage points, and the Covid crisis, where it only had 2.5 percentage points of room to cut. If, for example, a recession hit this April, after a quarter-point hike in March, the Fed would have only a quarter of a percentage point of room to cut. It is out of dry powder and will be for a while.
As this graph shows, most recessions are accompanied by drops in monetary velocity, as consumers and businesses cut back on spending due to falling demand for goods and services. The most precipitous fall in velocity was during the first stage of the Covid pandemic, when people in lockdown used their credit cards to purchase things online and in-person cash transactions at stores became temporarily rare.
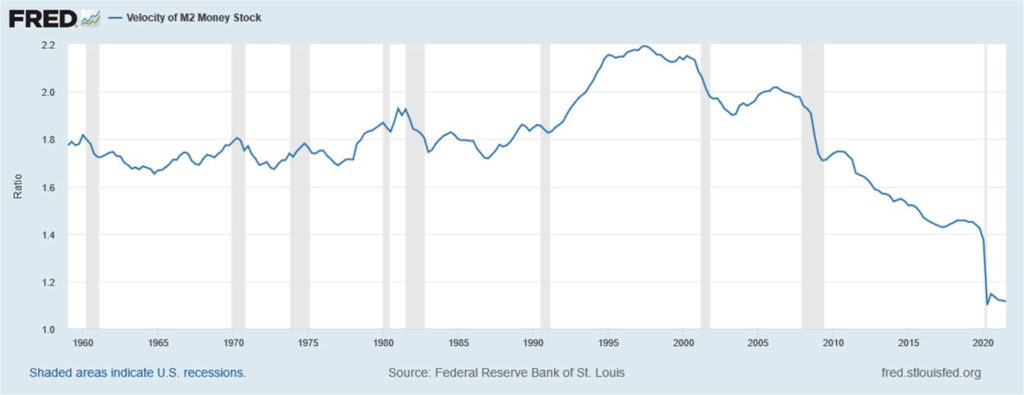
A decline in velocity can offset any attempts to stimulate an economy through rate cuts and stimulus handouts. According to a 2014 paper by the St. Louis Fed, this is what happened after the Great Financial Crisis: “…the unprecedented monetary base increase driven by the Fed’s large money injections through its large-scale asset purchase programs has failed to cause at least a one-for-one proportional increase in nominal GDP. Thus, it is precisely the sharp decline in velocity that has offset the sharp increase in money supply, leading to almost no change in nominal GDP.”
Volcker’s Ghost
Years after regional Federal Reserve banks concluded that flooding the markets with cash did not help the economy, it seems bizarre that the Fed did it again in response to Covid. And even more bizarre is that it is riding into its battle against inflation wielding rate increases as its main weapon, knowing that this will spur people to invest cash in interest-bearing accounts or securities, lowering M2 and raising velocity. As noted above, that will put upward pressure on inflation – exactly the opposite of what the Fed wants.
So why does the Fed – and most economists – hew to the line that raising rates reduces inflation? This idea goes back centuries, and was pithily captured by former Fed Chair William McChesney Martin, who said his job was to take away the punch bowl just when the party was getting started. In practice, it was Fed Chair Paul Volcker who cemented the idea in the popular mind. Appointed in 1979 with the mandate to bring under control U.S. inflation, which peaked at 14.8 percent in March 1980, he cranked the Fed Funds rate up to 20 percent, precipitating the worst recession since the Great Depression. Excoriated at the time for his radical, and seemingly heartless, policy, he is now generally seen as a sage and exemplar of clear-eyed monetary policy.
The causes of the current inflation spike are still unclear. But upward pressures on prices and wages are, in large part, due to the massive disruption in supply chains since the start of the pandemic, exacerbated by a lack of workers due to omicron-related quarantines and direct government payments to individuals. This shows, once again, that supply shocks, rather than money printing, can precipitate inflation, just as the Arab oil embargo of the early 1970s precipitated the last major bout.
Policymakers need to let the late Paul Volcker’s policy approach follow him into the hereafter, and look carefully at the causes of the current inflation and whether, in fact, they have any real tools to fight it. It might be that the U.S. economy is painted into a corner, and its citizens have little choice but to suffer the consequences of the last 14 years of short-sighted Fed policies.