
By: Paul Daneshrad, StarPoint Properties
Introduction
The debate raging in the financial commentariat over when and how much the Federal Reserve will cut interest rates is enough to make bewildered investors sympathize with Harry Truman. The 33rd president once groused, ““Give me a one-handed economist. All my economists say, ‘on the one hand…’, then ‘but on the other…”
Unfortunately, investors cannot simply sit back and wait for the dust to settle. The Fed’s eventual strategy is of crucial importance for both retail and professional investors alike because it will affect the prices of all asset classes.
The reason it is so difficult to forecast Fed rate actions is that their effect on the economy is fiendishly difficult to predict, so it is never clear when to stop or start changing rates. The Fed board itself is usually tied in knots over when to start cutting, and their political views often color their judgment.
Economists say that Fed rate changes affect economic activity through what’s called monetary transmission mechanisms, some of which are hard to measure, and/or cannot be accurately measured until long after the event. The initial economic measurements by government bean counters are revised each quarter by so much that, statistically, they resemble data provided by random number generators.
As the Corporate Finance Institute explains, the initial transmission mechanisms that are affected by changes to the Fed Funds rate (the central bank’s most important benchmark rate) are:
- Fixed income rates – personal, commercial and government bonds and loans.
- Asset valuations of every type, from real estate to art to the prices of gasoline and food.
- Expectations of consumers and business executives about future economic prospects; and
- Exchange rates.
All these affect:
- Demand for goods and services; and
- Import prices.
Both of which finally affect the real targets of Fed monetary policy: inflation and economic growth.
Despite all this, it is possible to look back at historical rate cutting cycles and glean some insight into what the next one holds in store. In this article, we will examine the last three rate cutting cycles, what caused them, and what happened in the subsequent years to inflation, economic growth, the stock market, and the housing market (since these are the factors that affect most investors). And despite the temptation to caveat every statement to smithereens like Truman’s policy wonks, we’ll keep one hand firmly, if figuratively, tied behind our backs.
The Federal Funds Rate over Time
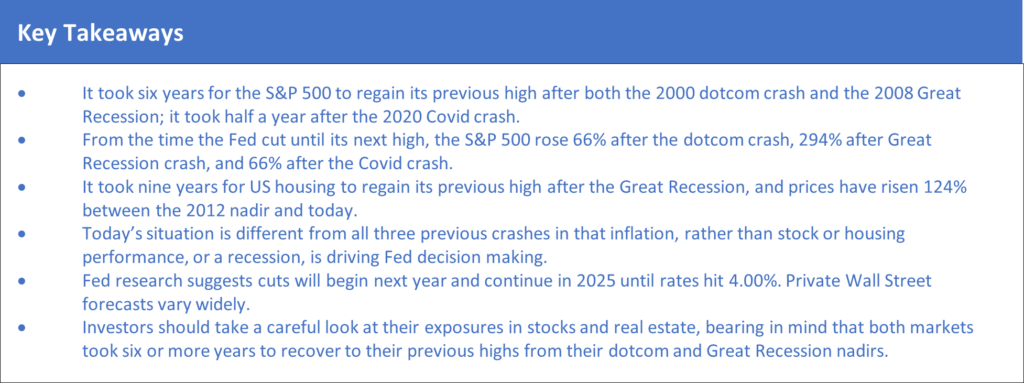
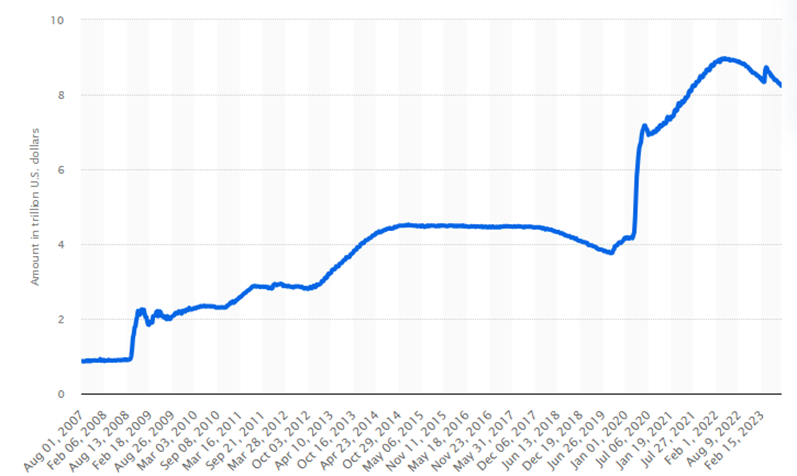
Figure 1 shows the Effective Federal Funds rate. This is set at eight meetings a year by the Fed’s Federal Open Market Committee, or FOMC to Fed watchers. The FOMC sets a target range, which as of August 2023 was 5.25% to 5.50%, for unsecured short-term loans. The Fed intervenes if the rate moves out of that range. It fluctuates within the range. For example, on August 18, it was 5.33%.
The gray bars on Figure 1 show recessions, and large Fed rate hikes to control inflation have almost always precipitated recessions. Critics say this is because the Fed is incompetent or nefarious. More likely, it is because predicting economic reactions to Fed rate activity is on par with predicting the weather – there are so many variables that it’s a nearly impossible task.
Figure 1: Effective Federal Funds Rate
Source: New York Fed via St. Louis Fed’s FRED system
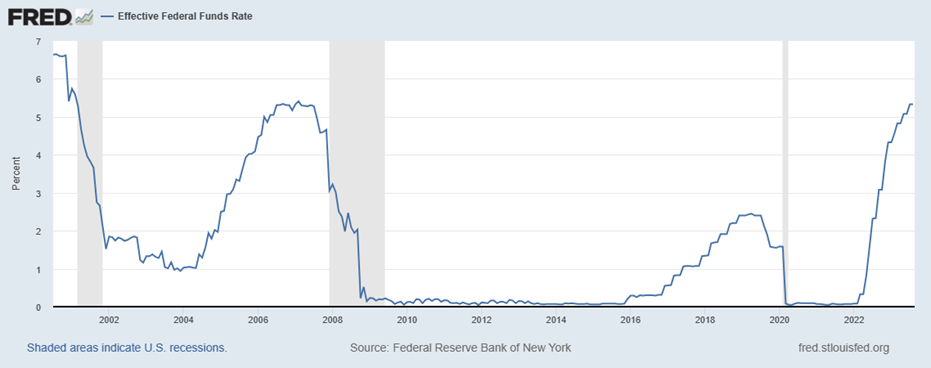
Goldman Sachs analyst Jan Hatzius and colleagues recently provided a taxonomy of Fed rate cuts, categorizing them by their size, their speed and the type of economic driver that caused the Fed to cut rates in each instance. (See Figure 2.)
The dark blue lines on Figure 2 show how much the Fed cut in each cycle. The light blue line indicates the speed of the cuts by showing how much the Fed cut in each quarter. So, for example, the Fed cut rates over twice as fast in 2020 as it did in the aftermath of the Great Recession in 2008.
Goldman divides the cutting cycles into three buckets:
- Normalizations: These are returns to the real natural rate, which is the rate that allows economic growth without spurring inflation.
- Growth Scares: Cuts meant to spur flagging economic growth; and
- Recessions: Cuts meant to pull the economy out of actual recessions, like the Great Recession of 2008.
The graph shows that Goldman is expecting total cuts of 2.25%, and characterizes the current cycle as a normalization, with the Fed hoping to return to the real natural interest rate.
Figure 2: Characteristics of Recent Fed Cuts, From Goldman Sachs via the Financial Times
Inflation Concerns in the Last Three Cycles
The principal reason the Fed raises rates is to combat inflation by slowing the economy. Indeed, originally, its mandate was only to control inflation by maintaining a stable money supply. But in 1977, Congress added the goal of maintaining economic growth as part of what is now known as the Fed’s “dual mandate”.
These are often competing goals – bringing inflation down, as noted above, often sets off a recession, and spurring economic growth often spurs inflation, making each policy decision something of a Hobson’s choice.
Controlling inflation is important for investors because it affects an asset’s real return, which is its stated (or “nominal”) return, minus inflation. An asset yielding 5% a year in an environment of 6% inflation is actually losing 1% of its value each year – its real return is -1%.
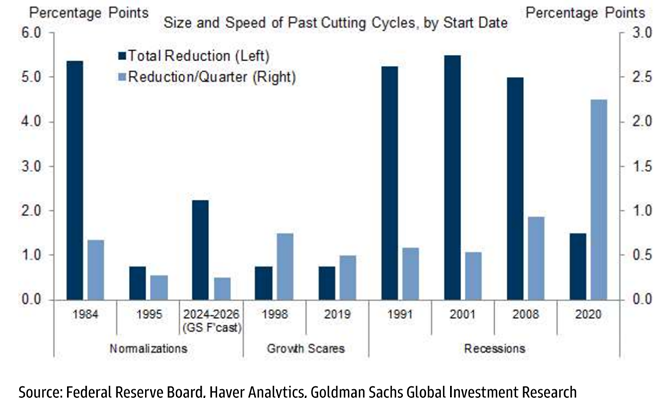
The relationship between the Fed Funds rate and inflation (measured by the Consumer Price Index) since 2000 is shown in Figure 3.
1. The Dotcom Cycle
In May of 1999, worried that the dotcom boom would fuel inflation, the Fed began raising rates from 4.75%. It stopped a year later at 6.50% as the dotcom stock bubble began bursting. About six months later, it began cutting again as the economy slid into recession, reducing rates sharply until mid-2003, by which time it had cut all the way down to 1.00%.
The picture here is complicated by a nonfinancial exogenous factor, the 9/11 attacks, which hammered the stock market. Unfortunately, exogenous factors are frequent. The oil shocks of the 1970s and the Covid-19 crisis of 2020 are examples of events that were outside the Fed’s control and that brought on or exacerbated recessions.
In fact, the Fed’s hikes during dotcom boom did little to bring down inflation. It took the recession to lower inflation from about 3.50% to a little over 1.00% in early 2002.
Figure 3: Fed Funds Rate and the Consumer Price Index
2. The Great Recession
The inflationary pressure caused by the 2000s housing boom was the next cause for the Fed to hike. It brought its benchmark from 1.00% in May 2004 up to 5.25% in June 2006, enough to knock inflation down from 4.30% to 2.20% a year later. Unfortunately, in June 2007 another crisis was brewing – the housing market was beginning to crash, triggering the massive Great Recession, which forced the Fed to cut rates to 0.25% to try to revive inflation and recover from a deflationary/recessionary spiral. This is an example of where the Fed wanted more inflation, which fell to nearly -2.00% during the crisis.
The Fed also embarked on a “quantitative easing” program through which it injected trillions of dollars into the economy by buying government and related debt.
3. 2015 Normalization
The Fed kept rates near zero until late 2015, when economic conditions allowed it to attempt to return to a “natural” rate – the process called “normalization.” The natural rate is the one which allows for economic growth without inflation, and it is the holy grail of Fed decision making. By late 2018, it had raised the rate by 2 percentage points, to 2.25%, where it paused, having brought nascent inflationary pressures under control.
It also began reducing its $4.5 trillion balance sheet, which had been swollen by the quantitative easing program. (See Figure 4.)
The normalization gave it the ability to cut rates by half a percent by 2020 in response to worries about economic growth. Then the Covid crisis hit, and the Fed slashed rates back to 0.25%.
Figure 4: Value of Assets on the Fed Balance Sheet
Source: Statista
4. The Current Cycle
As Figure 4 shows, the Covid crisis caused the Fed to redouble its quantitative easing strategy, blowing its balance sheet up to about $9 trillion. This massive monetary stimulus combined with fiscal policy moves like stimulus payments and loans, caused inflation to careen out of control, hitting a 40-year high of over 9% in 2022. This caused the Fed to begin to trim its balance sheet again and it quickly raised the Fed Funds rate to where it is today.
This has brought some elements of inflation down – the CPI has fallen sharply. But components of it, such as service-sector inflation, have remained stubbornly high.
Even so, many believe the Fed has inflation under control and should begin cutting. Below we will discuss when that might happen.
Bear in mind that in the three cycles, persistently low inflation allowed the Fed to respond to economic and market threats with rate cuts. Today, things are different. The resurgence of inflation has changed the Fed’s decision making and available toolkit.
How Rate Changes Have Affected the Economy, Stocks and Real Estate
Figure 5 shows the Fed rate changes along with GDP, the S&P 500 stock index, and the Case-Shiller Home Price index.
Figure 5: Fed Funds Rate, GDP, the S&P 500, and the Case-Shiller National Housing Index
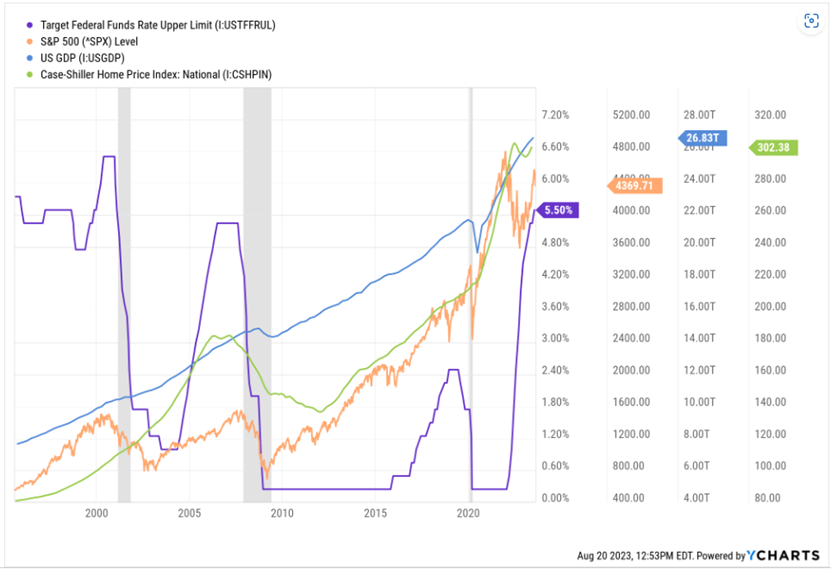
In all three of the previous crisis-related cycles (excluding the 2015 normalization), the Fed followed the strategy often derisively called “The Greenspan put.” This is the Fed’s willingness to bail out investors by lowering rates when stock markets crash. (A put option is often used to hedge against a market decline.) It was first used by Fed Chair Alan Greenspan after the 1987 crash, hence the name. Ben Bernanke, the next Fed chairman, was nicknamed “Helicopter Ben” for pursuing the same policy, which he (to his regret, perhaps) described as throwing cash out of a helicopter. Janet Yellen also followed suit.
The Fed slashed rates in all three cycles in response to market declines, and this resulted in rebounds, some of which provided extraordinary returns for investors. Figure 6 shows the key data points:
Figure 6: Rebound Performance from the Last Three Market Crashes
| Cycle | Years for S&P to regain previous high | Increase in S&P from nadir to next high | Years for GDP to regain previous high | Increase in GDP from nadir to next high | Years for Housing to regain previous high | Increase in Housing from nadir to next high |
| Dotcom crash | 6 | 66% | N/A* | N/A* | N/A* | N/A* |
| Great Recession | 6 | 294% | 1.5 | 48% | 9** | 124% |
| Covid crash | 0.5 | 66% | 1 | 36% | N/A* | N/A* |
*GDP and housing continued to grow though these cycles.
**Housing did not hit bottom until 2012.
Sources: YCharts, Statista, Federal Reserve Bank of St. Louis
From this data, discounting the Covid situation as uniquely affected by the exogenous variable of the pandemic, stock market investors can assume that stock market investors in a crash could have to wait about six years from the time the Fed cuts the Fed Funds rate to recoup their losses, and real estate investors may have to wait even longer.
Looking Ahead: When Will the Fed Start Cutting?
The big question, then, is when is it likely that the Fed will cut rates? The Fed Funds futures market is pricing in one more quarter-point hike in 2023, and Fed Chair Jerome Powell’s comments in July that more rate “hikes” – note the use of the plural – were possible implied that the Fed Funds rate could go to 6% this year.
An August 10 research report by Fed economists, “The Evolution of Short-Run r* after the Pandemic,” throws some light on the matter. As mentioned above, the Fed’s goal is to reach a “natural rate of interest,” one that keeps the economy growing without spurring inflation. Figure 7 shows how expectations of what this rate, called r*, have changed between December 2021 and March 2023.
To cut to the chase, the Fed’s model now expects that the Fed Funds rate will converge with the natural rate at about 5.25% next year and both will decline to 4.00% in about 2025. (See the right-most graph.) That implies cuts totaling three-quarters of a percent next year and another percent the following year.
In come Truman’s two-armed economists, spewing caveats. The authors write, “As always, we should remind readers that any projection shown here, including the FFR and r* projections, are not by any stretch of the imagination official forecasts of the New York Fed’s research staff and only reflect the output of one of the many models that the staff uses.”
But in terms of actual guidance from the Fed, the report is as clear a statement as we are going to get.
Figure 7: The Evolution of Monetary Policy and Short-Run Natural Rates Over Time
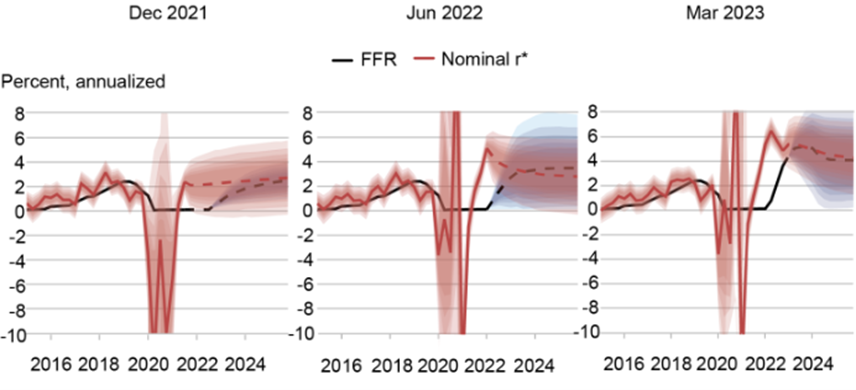
Source: The Evolution of Short-Run r* after the Pandemic, by Katie Baker, Logan Casey, Marco Del Negro, Aidan Gleich, and Ramya Nallamotu, New York Federal Reserve, Liberty Street Economics
Of course, every analyst on Wall Street has a view, and they differ widely. Goldman Sachs, in the report by Jan Hatzius and his colleagues cited above (which is well worth reading, as is the Financial Times article that summarizes the rate cut issues in the report), offers a more specific forecast. The firm calls for cuts to begin in the second quarter of next year and proceed in quarter-point increments until the rate reaches 3-3.25%.
Of course, the firm is full of diligent two-armed economists, so the report states, “But we do not see a strong need to cut and consequently we think there is a significant risk that the FOMC will instead hold steady.”
In fact, the Fed has been known to hold rates at high levels for significant periods of time, as the graphs above show. In the run up to the dotcom crash it held rates high from May to December 2000, and before the Great Recession, it kept them hiked for a full year.
Conclusion: What to Do?
Deciding on investment strategies when so much depends on the size and timing of a rate cut is like planning an outdoor party based on long-term weather forecasts – even if they predict a sunny day, you must also plan for rain. With so much uncertainty in the market, and everyone on a hair trigger, it’s best to focus on risk management. Whatever asset class you favor, look for investments that demonstrated low volatility during past cycles and have a positive real rate of return – meaning they have a yield that far exceeds the risk-free return and future inflation. Which also means we need to be patient and today might not be the best time to invest. History suggests that markets can take an awfully long time to recover from shocks, but it also suggests that long-term investors can see outsized gains if they stay the course.