
Predicting the exact timing of a recession poses a formidable challenge given the intricate interplay of various economic factors and the inherent complexities that contribute to the nature of economic downturns. However, that has not stopped economists, investors, and market participants from trying to predict when the next one will occur.
Below, we would like to draw your attention to one economic index, the US Conference Board Leading Economic Indicator (LEI). Historical LEI patterns have often anticipated economic contractions. While this pattern isn’t perfectly predictive, it does offer an additional data point for evaluating the state of the economy and its trajectory.
However, we also want to advise on the dangers of interpreting an indicator at face value without understanding its components. While the LEI’s historical pattern has been informative, changing economic factors and analytical insights suggest this time could be different.
US Conference Board Leading Economic Index
The US Conference Board LEI is controlled by the US Conference Board, a US-based research nonprofit. The index is itself a combination of other economic indicators. Unlike the US Gross Domestic Product, which is a lagging indicator and provides a snapshot of past economic activity, the LEI is a leading indicator because as a composite index, it aggregates forward-looking indicators from different areas of economic activity to provide a comprehensive view of the economy’s likely future trajectory.
Over time the LEI has evolved and incorporated different data points. Today, the LEI comprises 10 key data points, shown below in Exhibit 1.
Exhibit 1
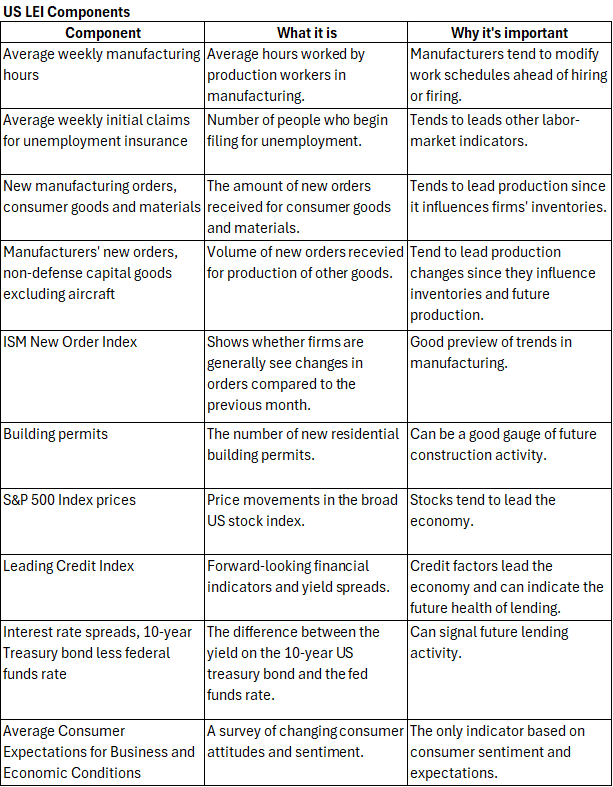
The US LEI and a Recession Pattern
The LEI has often proved predictive of recessionary periods.
As Exhibit 2 shows below, over the last 60 years, a decline of -4.4 percent on the LEI 6-month growth rate has led to recession all but twice. One can see the various instances, shaded light gray, where the U.S LEI experienced such a decline and a subsequent recession followed.
Historically, the LEI has dropped below its 6-month average anywhere between 2-15 months before a recession occurred.
Exhibit 2
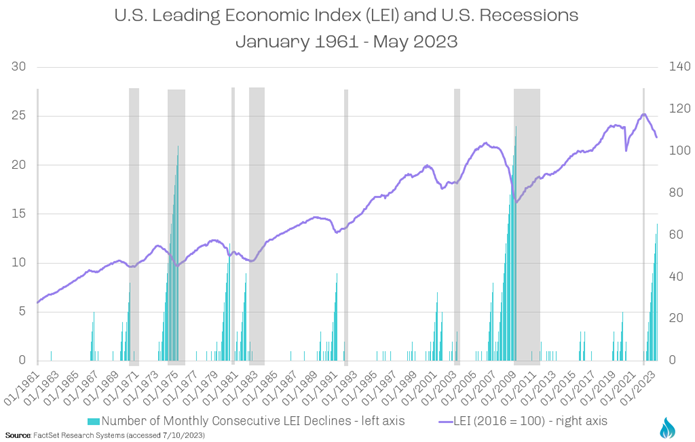
Exhibit 3 shows a rule called “the 3Ds” (Duration, Depth, and Diffusion) which helps explain how long, how deep, and how widespread a decrease in the LEI is. Duration measures how long a decrease lasts, and depth measures how big it is. Both duration and depth are calculated by looking at how much the index has changed over the last six months. Diffusion measures how widespread the decrease is across the components of the LEI.
The 3Ds signal a recession when two things happen at the same time: 1) the diffusion index falls below 50 (shown as the black dotted line in the chart), and 2) the decrease in the index over the last six months is more than 4.4 percent (shown as the red dotted line). The red dots on the chart mark the months when both these criteria are met, indicating a recession.
Exhibit 3
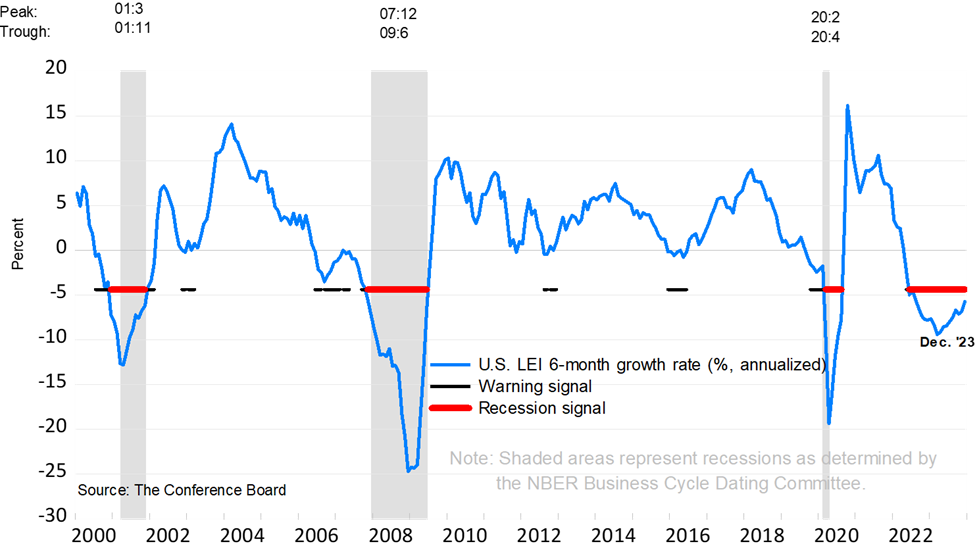
As seen above, despite a recent upswing in the 6-month growth rate, as of December 2023 the US LEI 6-month growth rate remains below the -4.4 percent barometer, signaling a recession may be on its way.
An LEI False Alarm
Looking closer at Exhibit 3, however, one might also argue for optimism. While the 6-month LEI growth rate remains negative, between June and December of 2023, the index inched closer to the positive, having contracted by 2.9 percent. Following the release of the December LEI index numbers, economists at Wells Fargo conveyed in an email that this positive contraction shows signs of optimism in the economy. They noted broad-based improvements in the index’s components, indicating that activity, particularly in interest-rate-sensitive sectors, has stabilized. This moderation aligns with speculations of avoiding a recession altogether, widely called a “soft landing”.
Recent economic indicators such as consumer sentiment, retail sales, and jobless claims have portrayed a positive picture of an expanding economy. This aligns with the viewpoint of Matthew Wolf from Business Insider. While Matthew agrees that the since 2021 the index “has never seen such a sharp and persistent decline without an economic recession unfolding shortly thereafter”, he also notes that the LEI may be another victim of pandemic related distortions due to “the underlying components of the index weighing goods too heavily and services not enough. That’s a problem when you consider that the makeup of today’s economy is roughly 85% services” (Business Insider).
Looking further into this trend, one can see that in the 1960s, services accounted for 60 percent of GDP, while goods made up the remaining 40 percent (Statista). Yet, by 2020, services accounted for 80 percent, with goods the remaining 20 percent. Additionally, according to the Bureau of Labor Statistics, 70 percent of US workers were employed in goods-producing industries during the 1960s. By 2020, the situation reversed, with around 80% of workers employed in the services sector.
Additionally, as of January 25th, the Bureau of Economic Analysis released data that showed US Real GDP increased at an annual rate of 3.3 percent in Q4 2023, which Wolf points out “is why the leading index failed to catch the sharp reacceleration in the US economy in the second half of 2023”.
Charting a Course Amid the Uncertainty
At Starpoint, we believe that the LEI is still a valuable data point when looking to assess the direction our economy is headed; its incorporation of other leading economic indicators allows it to provide a diversified analysis of the economy. However, as noted above, we agree that the US and its economy has drastically changed over the last few decades. Today the services economy is dominant and growing, though perhaps constrained by a lack of available labor.
To address these changes the LEI could possibly add further weight to the service sector to improve its prognostication abilities. However, we are now witnessing the beginning of a complete restructuring of global supply chains and flows of commerce. Much has been written about the secular trends of near-shoring and on-shoring. With the amount of manufacturing coming back to the US, it’s possible that the LEI’s goods-producing weighting comes back into focus. In the end, we hope that you take what you’ve learned and apply it to your own economic understanding. While economic indicators, like the LEI, can offer valuable insight, they remain just those—indicators. When interpreting them, it is important to do so with discipline, an understanding of its components, and with a comprehensive grasp of both micro and macroeconomic fundamentals.
Sources
CB Leading Economic Index: Continues to signal … (n.d.-a). https://www.advisorperspectives.com/dshort/updates/2024/01/22/leading-economic-index-conference-board-signal-underlying-weakness
Fox, M. (n.d.). One of the most commonly cited recession indicators that’s been flashing red has a major flaw, NDR says. Business Insider. https://www.businessinsider.com/recession-indicator-failed-economy-lei-cried-wolf-major-flaw-ndr-2024-1
Gross Domestic Product, Fourth Quarter and Year 2023 (Advance Estimate) | U.S. Bureau of Economic Analysis (BEA). U.S. Bureau of Economic Analysis (BEA). (n.d.). https://www.bea.gov/news/2024/gross-domestic-product-fourth-quarter-and-year-2023-advance-estimate#:~:text=Real%20gross%20domestic%20product%20(GDP,real%20GDP%20increased%204.9%20percent.
Leading economic indicators decline in December but show modest … (n.d.-b). https://www.usnews.com/news/economy/articles/2024-01-22/leading-economic-indicators-decline-in-december-but-show-modest-improvement
Lei: The “leading” edge of economic indicators. (n.d.-c). https://www.reuters.com/plus/lei-leading-edge-economic-indicators-fisher-investments
O’Neill, A. (2024, February 2). United States – distribution of the workforce across economic sectors 2021. Statista. https://www.statista.com/statistics/270072/distribution-of-the-workforce-across-economic-sectors-in-the-united-states/#:~:text=The%20statistic%20shows%20the%20distribution,and%2079.15%20percent%20in%20services.
The services powerhouse: Increasingly vital to world economic growth. Deloitte Insights. (n.d.). https://www2.deloitte.com/us/en/insights/economy/issues-by-the-numbers/trade-in-services-economy-growth.html US Conference Board Leading Economic Indicators. US Conference Board. (n.d.). https://www.conference-board.org/topics/us-leading-indicators